![]()
fancy way to generate scale bars with Tikz
The way to display scale bars shown here is nice, but can be a bit cumbersome if the images are not that easy, e.g. the image shows a skewed sample in 3D. Everything shown below could also be done completely by hand, but it's quite a boring task to calculate multiple rules of three for every image you want to add a scale bar. I've written a small MATLAB-script to facilitate the calculation and addition to LaTeX.
You'll need: 
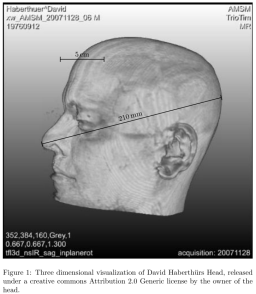
- an image you know the scale of and want to draw the scale bar on, e.g. the image shown on the right1)
- MATLAB with this m-file: scalebar.m (or any other graphics-capable calculation program like Octave)
- this minimal tex-file: scalebar.tex (I suppose you have a running installation of LaTeX to work with this example…)
Both files are explained in a bit more detail at the end of this page, for now I'll just walk you through:
WorkFlow
- Start MATLAB, load scalebar.m and start it.
- The script prompts you to load an image, choose “scalebarimage.jpg” you've downloaded from above.
- The script prompts you to define the length of the scale bar you're gonna draw in the next step, choose the default “21 cm” for now
- The script displays the image of my head and asks you to define a start-point of the scale-bar, choose the tip of the nose
- After that, choose the back of my head for the end of the scale-bar
- Note the “Positions” shown in the help-dialog, these are to make sure you've clicked correctly and that the positions are correct.
- copy the output in the command-line-section of MATLAB
- paste this output into your .tex-file
- if the .tex file and the image are in the same folder, just proceed, if not, change the path to the image!
- compile the file
- Figure 1 of the document should show
- the exact same scale-bar you've drawn in MATLAB overlayed over the image.
- a second scale bar which shows a reasonable length (5cm in our case)
- change \def\x{100} and \def\y{100} on lines 24 and 25 of the copied text to position the scale bar where you'd like to have it and uncomment line 29 to turn off the original scale bar.
- enjoy typographically correct scale bars in the resulting pdf (47 kB)

LaTeX-File
The preamble is nothing too fancy
\documentclass{article}
\usepackage{tikz}                 % used for actually drawing the scale bar
\usepackage[ansinew]{inputenc}    % is used so I can write my name without too much hassle
\usepackage{siunitx}              % excellent package to correctly typeset units
\usepackage{hyperref}             % used for URLs
The block below is used to start the document and to set up the image
\begin{document}
\author{David Haberthür}
\title{David Haberthür's Head - Scalebar}
\date{\today}
\maketitle
\begin{figure}[h]
	\centering
Inside here you'll copy the result from the MATLAB-skript, the rest ist just to finish off the document.
\caption{Three dimensional visualization of David Haberthürs Head, released under a \href{http://creativecommons.org/licenses/by/2.0/deed.en_GB}{creative commons Attribution 2.0 Generic license} by the owner of the head.}
	\label{fig:head}
\end{figure}
\end{document}
MATLAB-File
The block below asks the user to select an image-file that is then subsequently used for calculations
[ filename, pathname] = ...
     uigetfile({'*.jpg;*.tif;*.png;*.gif','All Image Files';...
          '*.*','All Files' },'Choose Input Image');

image=imread([pathname filesep filename]);
The scale bar is defined by asking the user to click on the image for a start- and end-point.
h = helpdlg('choose start-point of scale bar','ScaleBar');
uiwait(h);
[ x1,y1 ] = ginput(1);
the rest is just simple, but boring calculations and semi-nice output, which takes care of setting up the necessary lengths for TikZ.
References
TikZ: http://kogs-www.informatik.uni-hamburg.de/~meine/tikz/
MATLAB: http://blinkdagger.com/matlab/matlab-querying-the-user-for-input